
Quantifying India's Sovereign AI Infrastructure Deficit: Current State vs 2030 Trajectory
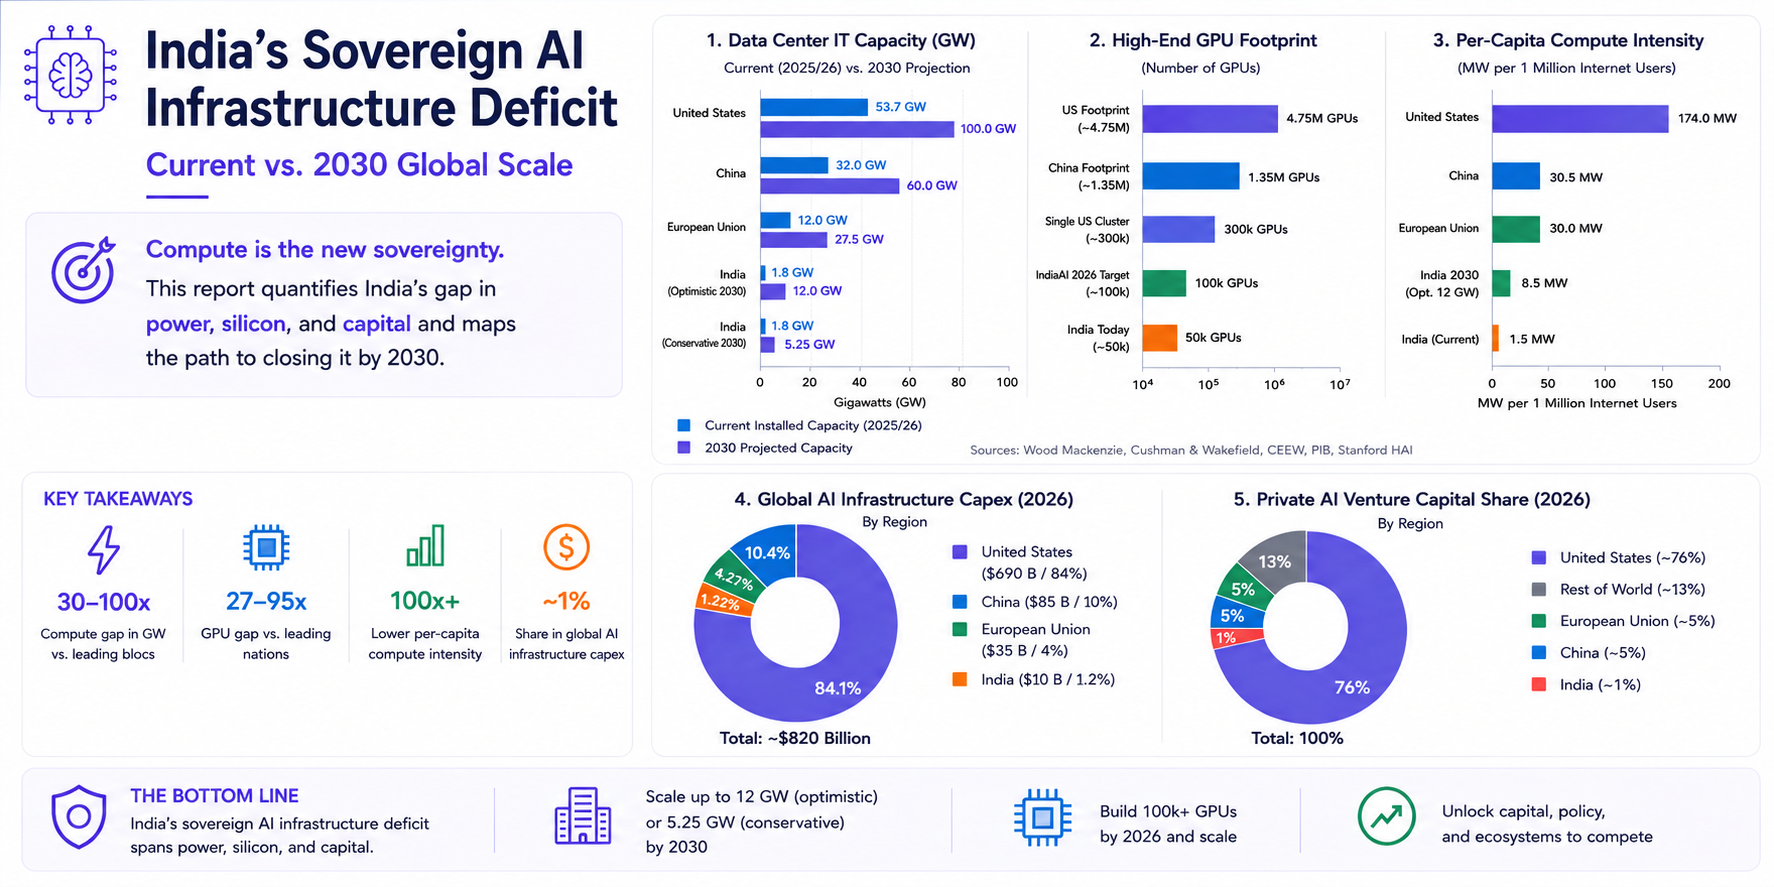
Table of Contents
Introduction
As artificial intelligence shifts from software applications to national infrastructure, the fundamental substrate of AI power (data-centre IT capacity measured in Gigawatts and high-end GPU accelerator clusters) has become a key determinant of technological independence. To understand where India actually stands today compared to leading technology blocs like the United States, China, and the European Union, I wanted to conduct a rigorous, empirical audit of global compute capacity.
To build this report, I leveraged deep-research capabilities across multiple AI systems (Gemini, ChatGPT, Claude, and Grok) to collect operational data, policy whitepapers, and market projections. I then harmonized the findings, resolved cross-source contradictions, and cross-fact-checked the dataset against primary trade releases (Wood Mackenzie, Cushman & Wakefield, CEEW, PIB, and Stanford HAI) to evaluate how far domestic build-outs close (or fail to close) the sovereign compute deficit by 2030.
This report evaluates the landscape in two parts; first establishing the empirical scale of India's infrastructure deficit across power, silicon, and capital, and then mapping the strategic pivots, cost advantages, and application-layer models that define a viable sovereign roadmap.
NOTE
Methodology & Data Disclaimer:
- Baseline Midpoints: Where industry trackers report a baseline range (e.g., India's current 1.3–2.2 GW operational IT load), charts use the standardized midpoint (1.8 GW) while text preserves explicit source-specific bounds (CareEdge/Cushman: 1.3–1.5 GW; Wood Mackenzie: 2.2 GW).
- 2030 Trajectory Scenarios: 2030 projections are modeled across both conservative industry consensus (5.25 GW midpoint) and optimistic upper-bound policy targets (12.0 GW Wood Mackenzie forecast).
- Accelerator Normalization: High-end accelerator footprint metrics normalize mixed hardware pools (H100, H200, B200, Ascend 910B/C) into H100-equivalent compute units.
- Currency References: Financial metrics use 2026 prevailing exchange reference rates ($1 ≈ ₹93 midpoint, baseline range ₹90–95).
Part I: Quantifying the Structural Deficit
Data Center Capacity: The Core Gap
Data centre capacity, measured in Megawatts (MW) or Gigawatts (GW) of delivered IT load, forms the foundation of all digital and AI workloads.
Current Baseline (2025 / Early 2026)
- United States: ~53.7 GW installed IT capacity, representing approximately 44% of global ~122.2 GW capacity 1.
- China: ~32.0 GW operational IT capacity at end-2025 2.
- European Union: ~12.0 GW aggregate capacity across key FLAP-D and regional hubs 3.
- India: 1.3–2.2 GW total operational IT load 4, 5. Lower-bound industry trackers (Cushman & Wakefield, CareEdge) report ~1.3–1.5 GW 5, 6, while Wood Mackenzie reports an operational baseline of 2.2 GW in 2025 4.
2030 Projections across Regions
| Region | 2030 Projected Capacity | Baseline Source / Policy Drivers |
|---|---|---|
| United States | 100+ GW | Hyperscaler demand expected to more than double 7 |
| China | ~60.0 GW | Rystad Energy / fDi Intelligence near-doubling forecast 2 |
| European Union | 25–30 GW | EuroHPC Joint Undertaking & AI Gigafactories pipeline 3, 8 |
| India (Optimistic) | 12.0 GW | Wood Mackenzie report (July 2026) 4 |
| India (Conservative) | 4.0–6.5 GW | CareEdge Ratings & Rubix Data Sciences consensus 6 |
Under the conservative trajectory (4.0–6.5 GW), India's total 2030 data-centre infrastructure would remain comparable to the size of a single large US metropolitan market today. Even under the most optimistic published forecast (Wood Mackenzie's projection of 12 GW by 2030 4), India's absolute data-centre capacity remains roughly 1/5 of China's 2 and 1/8 of the United States' 7 projected 2030 base.
Compute Pool Deficit: GPUs and Accelerators
Hardware accelerator pools (H100-equivalent GPUs) dictate frontier training and inference capability.
| Compute Pool | Scale (H100-equivalents) | Ratio to India Today |
|---|---|---|
| India National Pool (Public + Private) | 38,000–60,000 9, 10 | 1× |
| IndiaAI Target (End-2026) | ~100,000 11 | ~2–2.5× |
| Single US Hyperscaler Training Cluster | 100,000–500,000+ 10, 12 | 2–10× India's entire national pool |
| US National High-End Footprint | ~4.5–5.0 million 10 | ~80–100× |
| China High-End Footprint (incl. Ascend) | ~1.2–1.5 million 10 | ~25–30× |
Through the IndiaAI Mission (MeitY / PIB), the Government of India has onboarded 38,231 GPUs made accessible at subsidised rates 9. While this provides an essential public good for academic research and early-stage startups, the total national pool remains smaller than individual frontier clusters operated by major technology firms in the US.
Per-Capita Compute Intensity: The Deep Disparity
Dividing installed IT power capacity by active internet-user populations highlights the domestic availability of compute infrastructure per user.
- United States: ~174 MW per 1 million internet users 13.
- China: ~30.5 MW per 1 million internet users 13.
- European Union: ~30 MW per 1 million internet users 13.
- India: ~1.5 MW per 1 million internet users 13.
India's per-user compute provisioning stands at approximately 1/115th of the United States and about 1/20th of China or the EU 13. This metric captures the structural scarcity experienced by domestic researchers, enterprises, and developers seeking locally hosted high-density compute.
Capital Deployment: Investment, CAPEX, and R&D Spend
The capital intensity of AI infrastructure has become the clearest dividing line between technology blocs. The United States is funding the build-out primarily through private hyperscaler balance sheets; China combines large state guidance funds with platform capex; the EU leans on public procurement leverage; India remains an order of magnitude smaller on both private and public absolute spend.
| Category | United States | China | European Union | India |
|---|---|---|---|---|
| 2026 Big Tech / Hyperscaler Capex | ~$680–725 B (Amazon ~$200 B, MSFT ~$190 B, GOOG ~$175–185 B, Meta ~$115–145 B) 14 | ~$35–50 B (Alibaba, Tencent, ByteDance, Baidu) + large state funds 15 | Modest private; €30 B+ mobilised for AI Gigafactories (multi-year) 8 | ~$3–5 B annualised private DC; ~$15–28 B multi-year announced 16 |
| Private AI VC (Recent Annual) | ~$160–286 B (dominant global share) 10 | ~$12–14 B (excludes much state capital) 10 | ~$8–16 B aggregate 10 | ~$0.6–2 B (application-heavy) 10 |
| Primary Sovereign Subsidy | CHIPS Act $52.7 B + NSF/DOE | Big Fund Phase III ~$47.5 B + provincial funds 15 | EuroHPC ~€8–10 B; InvestAI / Gigafactories leverage 8 | IndiaAI ~$1.25 B (5 yr); Semiconductor Mission ~$9–13 B 9, 17 |
- United States: Private capital intensity is the defining feature. A handful of companies are spending more in a single year than the cumulative multi-year public programmes of most other regions combined.
- China: Disclosed private AI VC appears modest relative to output. A large share of resources flows through state guidance funds (such as Big Fund Phase III) and state-linked enterprises rather than classic venture structures.
- European Union: Public capital is used as an anchor to de-risk private investment (EuroHPC, InvestAI, AI Gigafactories) rather than to match hyperscaler scale directly.
- India: Absolute public and private numbers remain small. The IndiaAI Mission (~$1.25 B over five years) and Semiconductor Mission (~$9–13 B range) are meaningful policy signals, but private DC commitments in the low tens of billions multi-year are still a fraction of a single US hyperscaler's annual guidance.
Physical Constraints: Grid and Power-Delivery Readiness
Installed IT load (GW) can only operate if power delivery and cooling resources are available.
- United States: Grid power interconnection queue delays have become the primary constraint for data-centre development 18, 19.
- China: State-level planning and generation expansion provide headroom, though regional transmission limits affect eastern demand centers 2.
- India: Data centres face dual constraints in power grid capacity and water availability. CEEW research highlights structural tensions between utility (discom) allocations, open-access renewable routing, and rising water consumption for cooling (projected to increase from 150B Litres in 2024 to 358B Litres by 2030) 20. High average Power Usage Effectiveness (PUE 1.4–1.6 vs global best-in-class 1.1–1.25, where 1.0 represents perfect efficiency) 21 increases effective energy requirements per unit of IT capacity.
Part II: The Strategic Pivot — Asymmetric Advantages & Pathways
Training vs. Inference: Why the Deficit Is Not Uniform
Raw accelerator counts and GW figures are primarily driven by frontier model training. However, compute requirements are shifting across model lifecycles:
- Shifting Workload Share: Industry analyses project that inference will account for roughly two-thirds of all AI compute in 2026 (up from ~33% in 2023 and ~50% in 2025) 22.
- Lifetime Economics: Over the operational lifecycle of a deployed model, inference accounts for 80–90% of total compute cost 23.
Strategic Implications for Sovereign AI
Matching US or Chinese frontier training clusters dollar-for-dollar may not be necessary or feasible in the near term. A targeted sovereign strategy focused on:
- Efficient model inference and serving architecture,
- Model distillation, quantization, and pruning,
- Multilingual and domain-specific vertical models, and
- Edge and local deployment pipelines
can extract substantial utility from a smaller GPU base. India's enterprise AI adoption rate (~59%) 24 positions it to capture value at the application and inference layer.
Cost of Compute: IndiaAI Subsidies vs. Global Commercial Rates
| Provider / Pool | Approx. H100-Class Rate (2026) | Notes / Source |
|---|---|---|
| IndiaAI Mission (Subsidised) | ₹65–67 per GPU-hour (~$0.70–$0.72) | Available to startups & academia 9, 25 |
| Indian Commercial Reference | ~₹115 per GPU-hour (~$1.24) | Pre-subsidy domestic market reference 25 |
| Specialist Clouds (Lambda / RunPod) | ~$2.00–$4.00 per GPU-hour | On-demand H100 pricing 26 |
| CoreWeave (HGX H100/H200) | ~$6.16–$6.31 per GPU-hour | Dedicated node pricing 27 |
| Major Hyperscalers (AWS / Azure) | ~$6.00–$12.00+ per GPU-hour | On-demand instance pricing 26, 28 |
IndiaAI's subsidised rate of ₹65–67/hour is roughly 3–8× lower than Western on-demand H100 pricing 9, 25, 26. While subsidies do not increase absolute physical capacity, they lower economic barriers for domestic developers running fine-tuning and inference workloads.
IP, Talent Density, and Enterprise Adoption
Technological output is visible in the volume and quality of frontier models, patent filings, research publications, and the retention of top-tier researchers.
| Metric | United States | China | European Union | India |
|---|---|---|---|---|
| Notable Frontier Models (2025) | ~50–59 (OpenAI, Google, Anthropic) 10 | ~15–35 (DeepSeek, Qwen, Ernie) 10 | ~3 (Mistral, Aleph Alpha) 10 | Emerging (Sarvam 30B/105B; Indic-focused) 9 |
| US–China Benchmark Gap | Baseline leader | ~2.7 pp gap (Stanford HAI 2026) 10 | Larger gap vs leaders | Not yet frontier-competitive |
| AI Patent Share (Global) | ~7–25% (higher citation impact) 10 | ~70% (volume leader) 10 | ~3–18% 10 | <1% 10 |
| AI Research Publications Share | ~25–40% (highest impact) 10 | ~18–28% (volume leader) 10 | ~11–18% 10 | ~5–8% (growing fast) 10 |
| Top-Tier Talent Retention | ~52% of elite AI researchers 10 | ~18% 10 | ~10% aggregate 10 | High graduate volume; net brain drain of architects 10, 29 |
| Enterprise AI Adoption | ~50–55% 24 | ~50% 24 | ~20% (higher in large enterprises) 24 | ~59% (reported global leader in adoption rate) 24 |
Key Structural Takeaways
- Models and Benchmarks: The United States continues to produce the largest number of notable frontier models. China's performance gap on major benchmarks has narrowed dramatically (to roughly 2.7 percentage points by early 2026). India has begun releasing sovereign and multilingual models (e.g. Sarvam, Krutrim), but is not yet competitive at the global frontier.
- Patents and Publications: China leads decisively on raw patent volume (~70% of global AI patents). The United States retains an edge on high-impact, highly cited patents and selective conference oral papers. India's patent share remains under 1%, though its publication share (~5–8%) is growing from a low base.
- Talent Retention: The United States attracts and retains ~52% of elite global AI researchers. India produces a large volume of STEM graduates and hosts ~20% of the world's semiconductor design engineers, yet experiences a net outflow of senior architecture-level talent to US and European labs.
- Enterprise Adoption: Enterprise AI adoption in India (~59%) leads major surveyed economies. High adoption creates an active domestic market for model fine-tuning, inference serving, and application-layer deployment.
Strategic Imperatives and Sovereign Roadmap
While India faces an absolute capacity deficit in training-scale infrastructure, the domestic ecosystem possesses key competitive structural factors:
- Construction Cost Efficiency: Data-centre development costs in India are estimated to be 30–40% lower than US/European averages 6.
- Enterprise AI Adoption: India maintains an enterprise AI adoption rate of approximately 59%, among the highest in major surveyed economies 24.
- Digital Public Infrastructure (DPI): High-volume data platforms (UPI, Aadhaar, DigiLocker) provide vast domestic data assets 30.
- Design Engineering Talent: India accounts for roughly 20% of global semiconductor design engineers 29.
- Public Compute Subsidies: IndiaAI provides competitive public GPU hourly rates 9, 25.
A sustainable sovereign roadmap prioritizes expanding public compute utilization, upgrading power efficiency (PUE optimization), and establishing dedicated domestic inference infrastructure.
Footnotes
Synergy Research Group data (Q1 2025): global data-centre IT power capacity ~122.2 GW; United States 53.7 GW (~44%). ↩
Rystad Energy, “China’s data center capacity set to top 60 GW by 2030,” 29 April 2026: https://www.rystadenergy.com/news/chinas-data-center-capacity-doubling-of-power ; fDi Intelligence, July 2026: https://www.fdiintelligence.com/content/b22fd8c8-da27-463a-be13-7107d6ba1f3c ↩ ↩2 ↩3 ↩4
EuroHPC Joint Undertaking & European Commission AI Factories materials: https://www.eurohpc-ju.europa.eu/ ↩ ↩2
Wood Mackenzie, “India data centre capacity to reach 12 GW by 2030,” press release, 27 July 2026. https://www.woodmac.com/press-releases/india-data-centre-capacity-to-reach-12-gw-by-2030/ ↩ ↩2 ↩3 ↩4
Cushman & Wakefield, Global Data Center Market Comparison 2025–2026: https://www.cushmanwakefield.com/en/insights/global-data-center-market-comparison ↩ ↩2
CareEdge Ratings and Rubix Data Sciences forecasts for India data-centre capacity (4–6.5 GW by 2030) and construction-cost differentials, 2026. ↩ ↩2 ↩3
IEA and JLL Global Data Center Outlook research indicating US data-centre demand could more than double by 2030 (100+ GW): https://www.jll.com/en-us/insights/market-outlook/data-center-outlook ↩ ↩2
European Commission Digital Strategy and EuroHPC Joint Undertaking materials on AI Gigafactories. ↩ ↩2 ↩3
Press Information Bureau / MeitY: IndiaAI Mission onboarded 38,231 GPUs at subsidised rates (~₹65/hr). PIB: https://www.pib.gov.in/PressReleasePage.aspx?PRID=2229397 ; IndiaAI Portal: https://indiaai.gov.in/hub/indiaai-compute-capacity ↩ ↩2 ↩3 ↩4 ↩5 ↩6 ↩7
Stanford HAI AI Index (2026 Report): https://hai.stanford.edu/ai-index/2026-ai-index-report ↩ ↩2 ↩3 ↩4 ↩5 ↩6 ↩7 ↩8 ↩9 ↩10 ↩11 ↩12 ↩13 ↩14 ↩15 ↩16 ↩17 ↩18 ↩19 ↩20 ↩21 ↩22 ↩23 ↩24
IndiaAI Mission public target trajectory toward 100,000 GPUs by end-2026. ↩
Industry reporting on large US training clusters (xAI Colossus, Meta, Microsoft, Google, Amazon pods). ↩
Derived metric: installed capacity divided by internet user populations (US ~310 M, China ~1.05 B, EU ~400 M, India ~1.0 B). ↩ ↩2 ↩3 ↩4 ↩5
Hyperscaler 2026 capex guidance aggregated across corporate earnings reports (Amazon, Microsoft, Alphabet, Meta, Oracle): https://valueaddvc.com/blog/big-tech-ai-capex-in-2025-microsoft-google-meta-amazon-and-the-spending-race ↩
Stanford HAI AI Index & Chinese National Integrated Circuit Industry Investment Fund Phase III (~$47.5 B). ↩ ↩2
MeitY IndiaAI Mission budget (₹10,372 crore / ~$1.25 B over five years) and private data-centre commitments: https://indiaai.gov.in/ ↩
India Semiconductor Mission / MeitY; Tata Electronics–PSMC Dholera fab targeting mature nodes (28–110 nm) late 2026. ↩
Hanwha Data Centers & Enki AI reports on grid power bottlenecks: https://www.hanwhadatacenters.com/blog/data-center-grid-limitations-the-power-bottleneck/ ; https://enkiai.com/data-center/data-center-power-crisis-2026-the-grid-bottleneck/ ↩
Lawrence Berkeley National Laboratory interconnection queue research: https://emp.lbl.gov/queues ↩
Council on Energy, Environment and Water (CEEW), “How Is Data Centre Infrastructure in India Shaping Power and Water Use,” February 2026: https://www.ceew.in/publications/how-is-data-centre-infrastructure-in-india-shaping-power-and-water-use ↩
Industry PUE benchmarks (Statista, CareEdge commentary): global best-in-class ~1.1–1.25; Indian average 1.4–1.6. ↩
Deloitte, “More compute for AI, not less” (Technology Predictions 2026): https://www.deloitte.com/us/en/insights/industry/technology/technology-media-and-telecom-predictions/2026/compute-power-ai.html ↩
Introl & Gartner industry analyses on inference vs training economics: https://introl.com/blog/ai-inference-vs-training-infrastructure-economics-diverging ↩
IBM Global AI Adoption Index / Deloitte industry surveys reporting enterprise AI adoption rates in India (~59%). ↩ ↩2 ↩3 ↩4 ↩5 ↩6
MeitY / IndiaAI releases: subsidised rates of ₹65–67 per GPU-hour; domestic reference rates ~₹115/hr. PIB: https://www.pib.gov.in/PressReleasePage.aspx?PRID=2225781 ↩ ↩2 ↩3 ↩4
Cloud GPU pricing trackers (Lambda Labs, RunPod, GMI Cloud, Silicon Analysts): https://lambda.ai/pricing ; https://siliconanalysts.com/tools/cloud-pricing ↩ ↩2 ↩3
CoreWeave published pricing (2026): HGX H100 on-demand ~$6.16/hr, H200 ~$6.31/hr: https://www.spheron.network/blog/coreweave-h100-h200-pricing-2026/ ↩
AWS EC2 / Azure public pricing pages: https://aws.amazon.com/ec2/pricing/ ↩
Stanford HAI AI Index talent-migration and retention data; Indian semiconductor design workforce share (~20% global). ↩ ↩2
Government of India / NPCI digital public infrastructure dashboards (UPI, Aadhaar). ↩